01
The Brief
Know what to say before the meeting.
The few things worth telling your client, with the ads to back each one up.
For agencies and marketing teams in Australia.
See what your client’s competitors are advertising, where they’re running it, and what changed. Every figure shows its evidence. We tell you what we can’t see.
05 · The Receipt
Prove it. The source, the date we looked, out of how many, and what we couldn’t see.
Our worked example
From a rival's move to a client-ready deck, with proof on every slide.
01
CommBank today
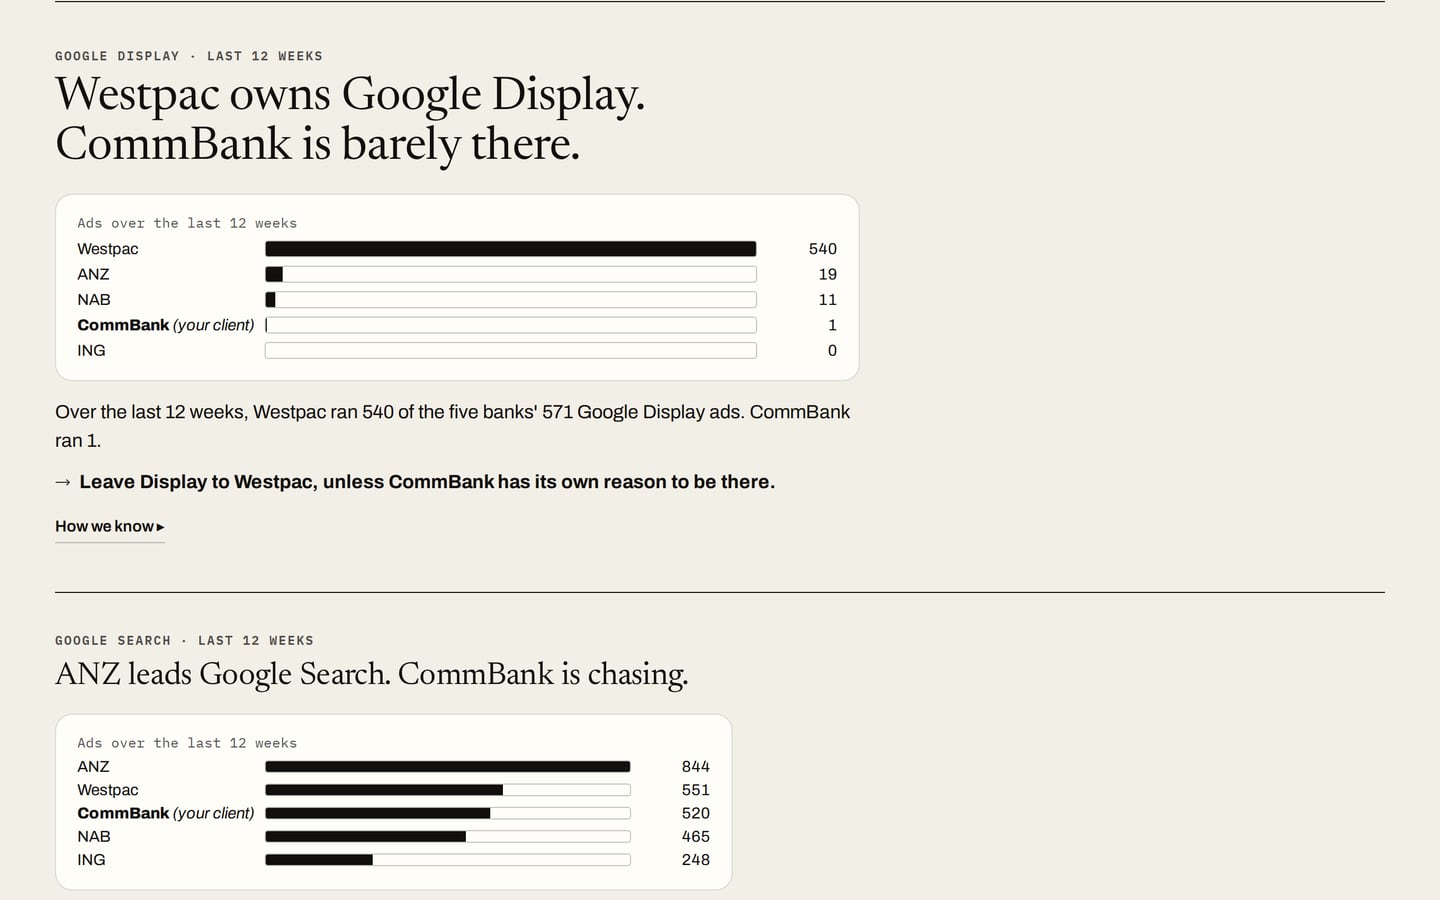
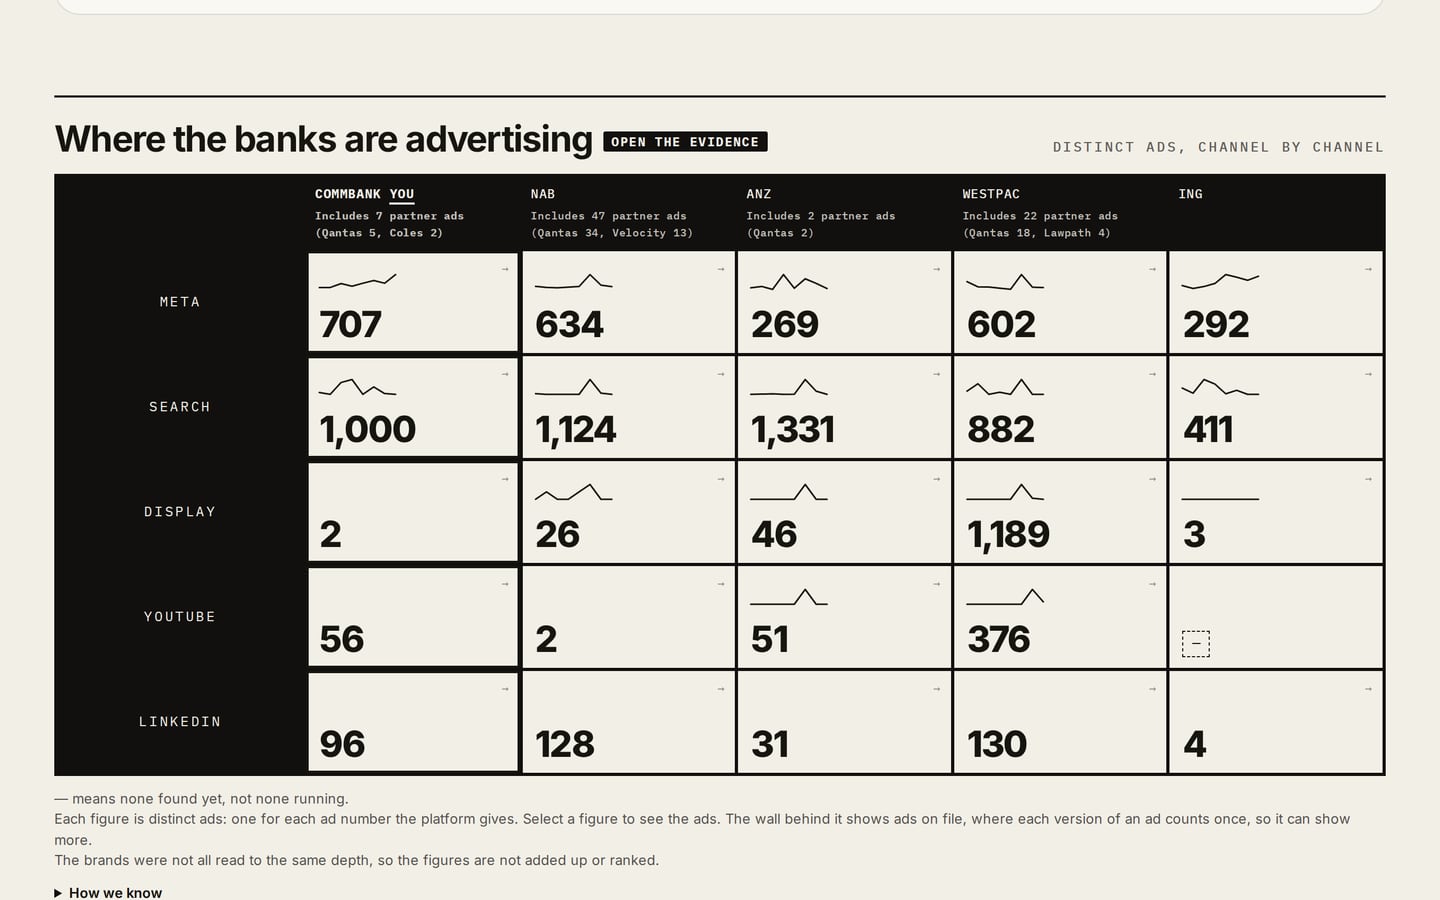
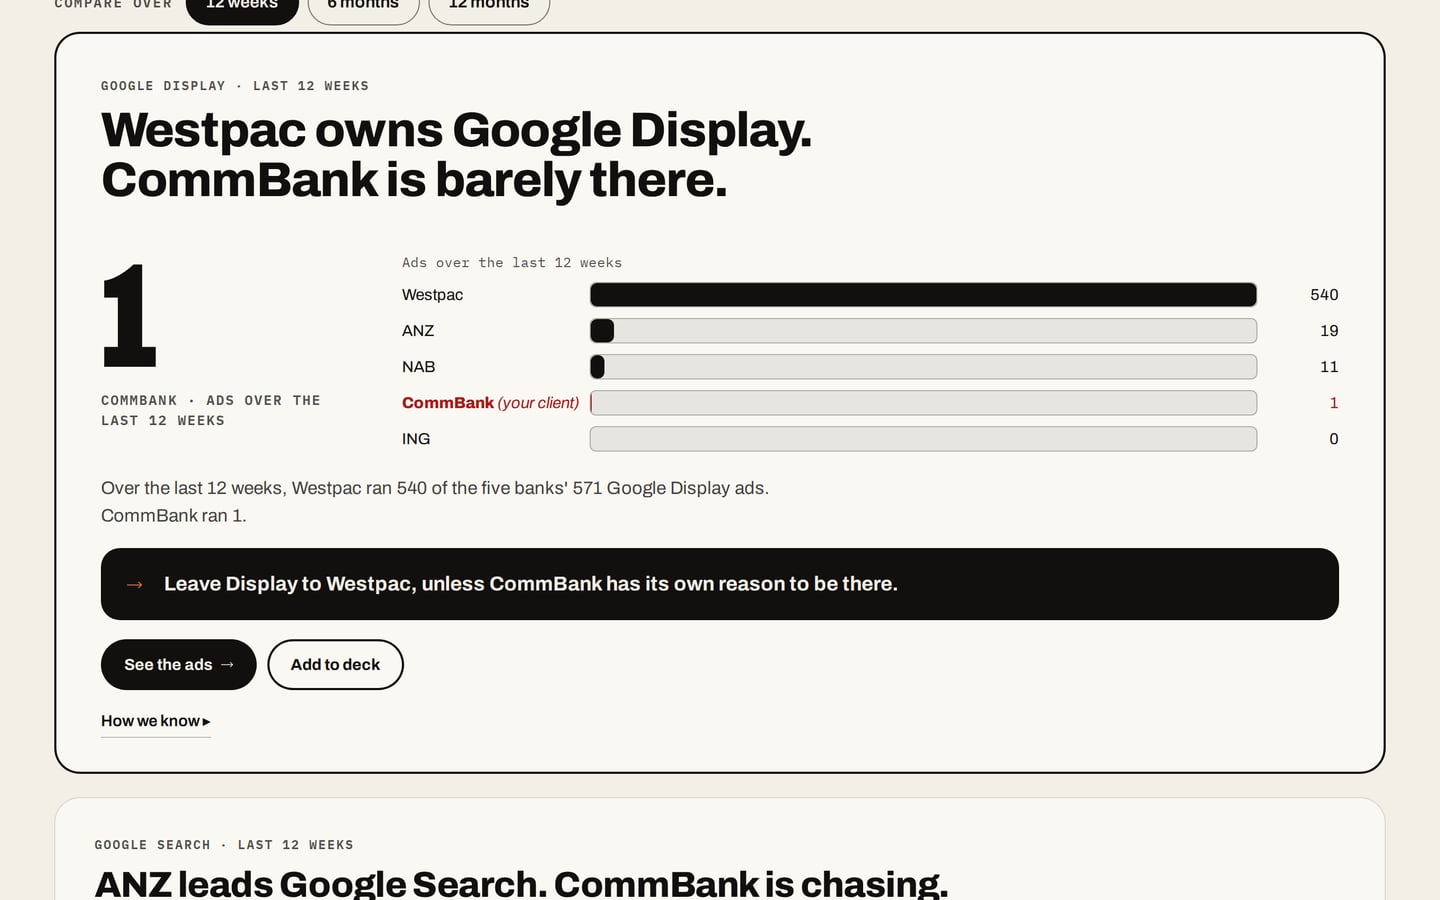
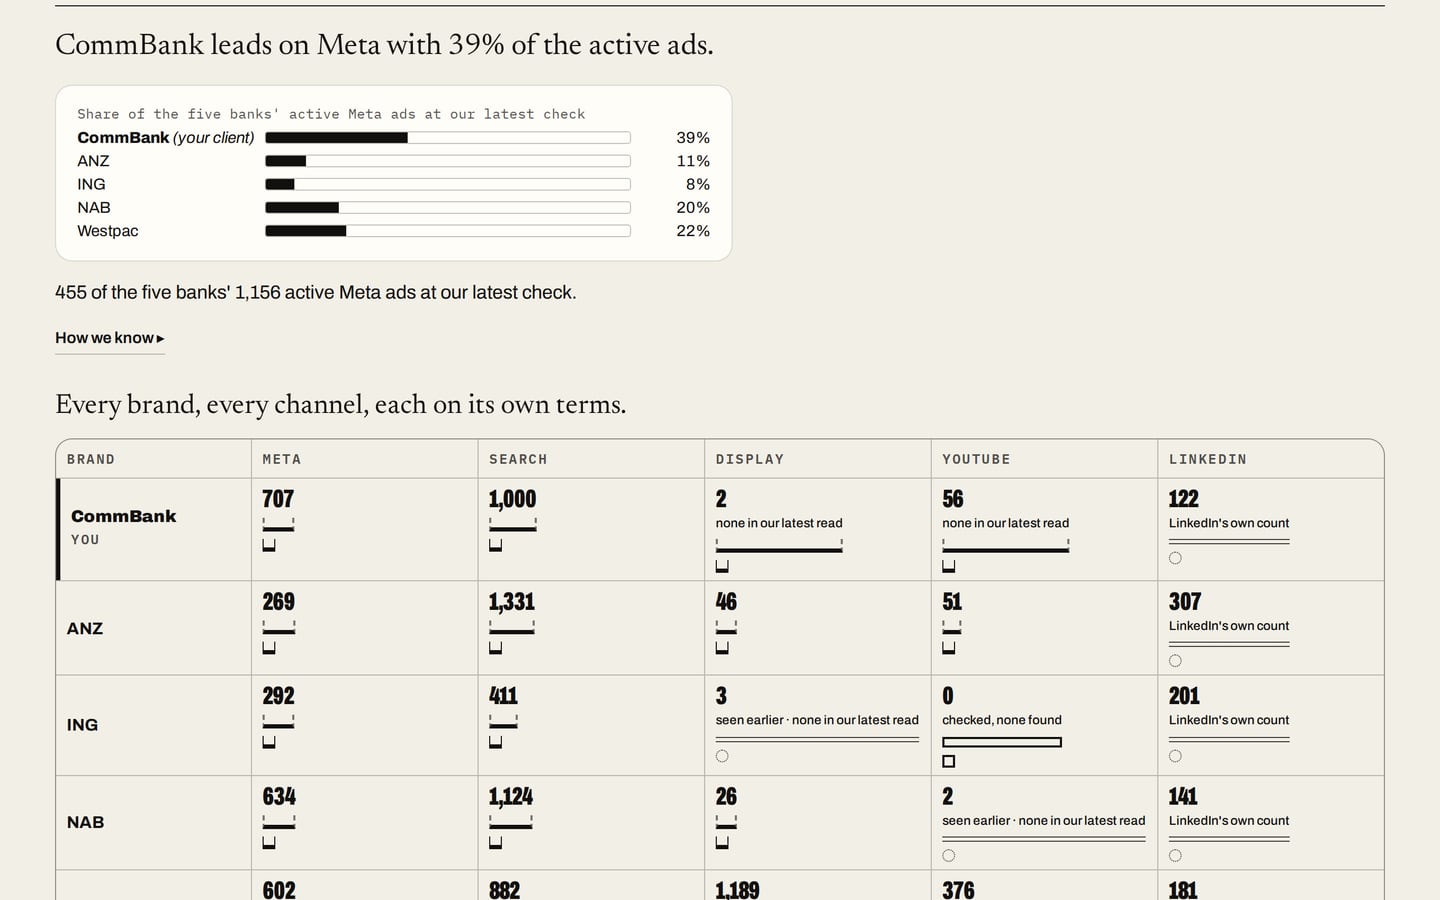
CommBank leads Facebook and Instagram. Westpac owns Display. ANZ leads Search. All on one screen.
02
A competitor’s move
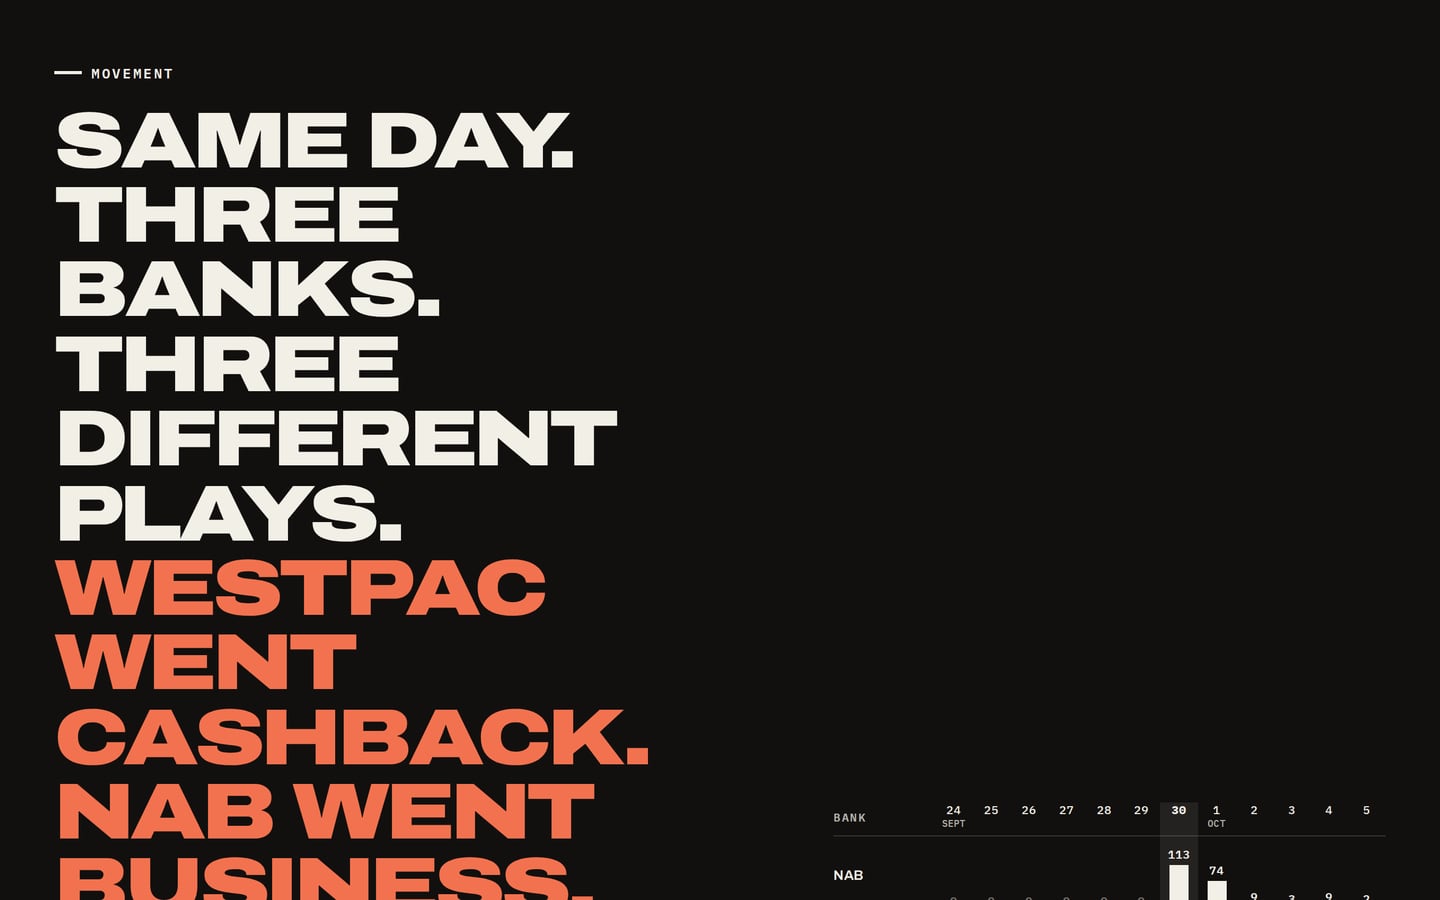
Google search interest in home loans fell 12.7% on the quarter before. In that same stretch, Westpac went cashback, NAB went business and ANZ added Search and YouTube, all on one day.
03
What it means for CommBank
NAB swung to business, yet CommBank still runs more business banking ads than any other bank. You get the read and the move to make.
04
The ads behind it
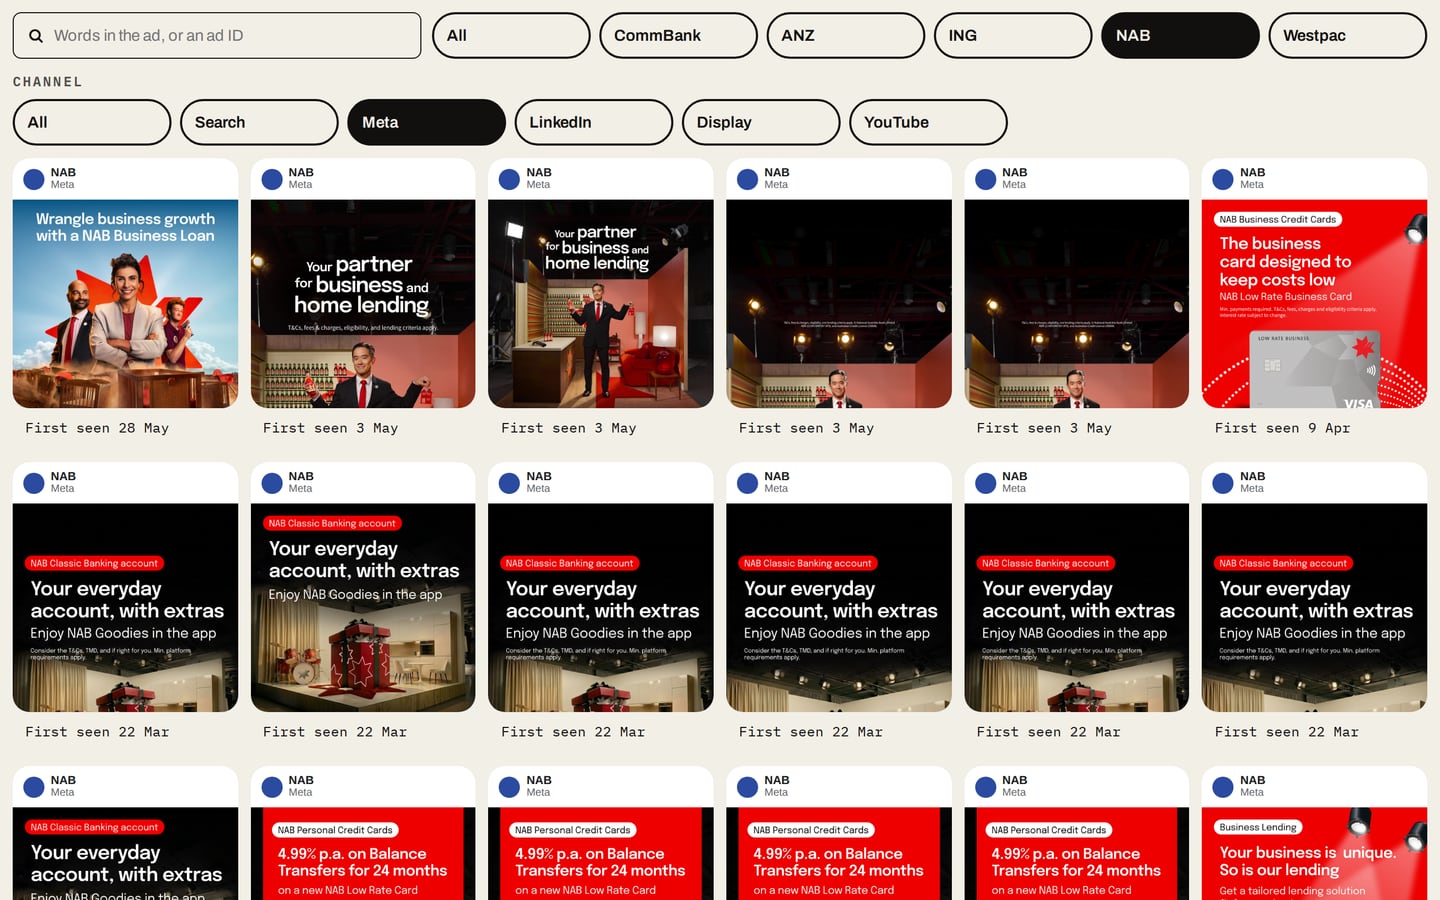
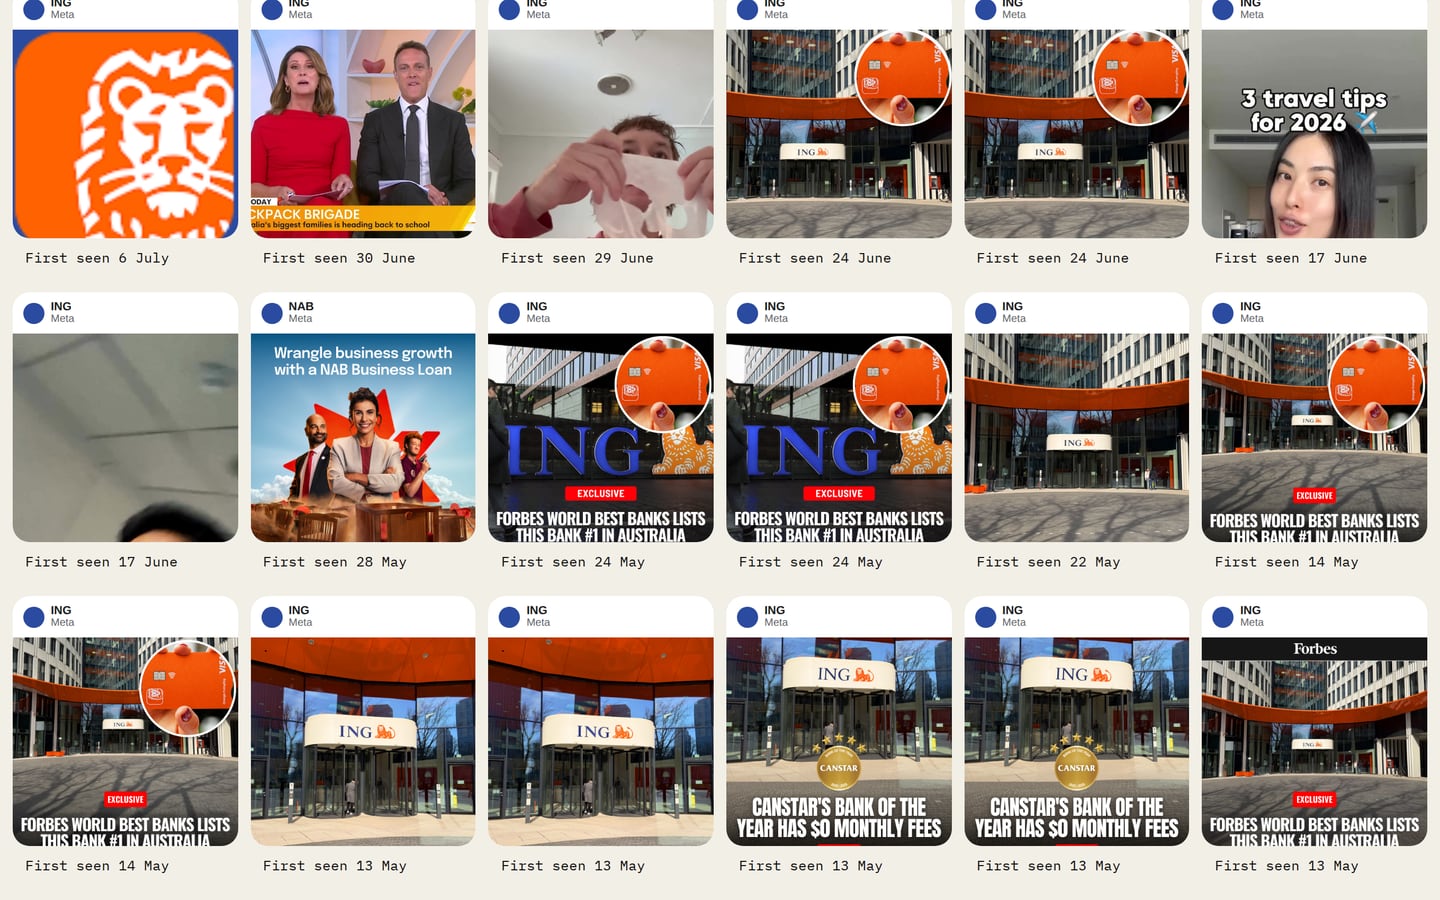
Open NAB's ads as they ran, with the day Meta says each one started.
05
The client deck
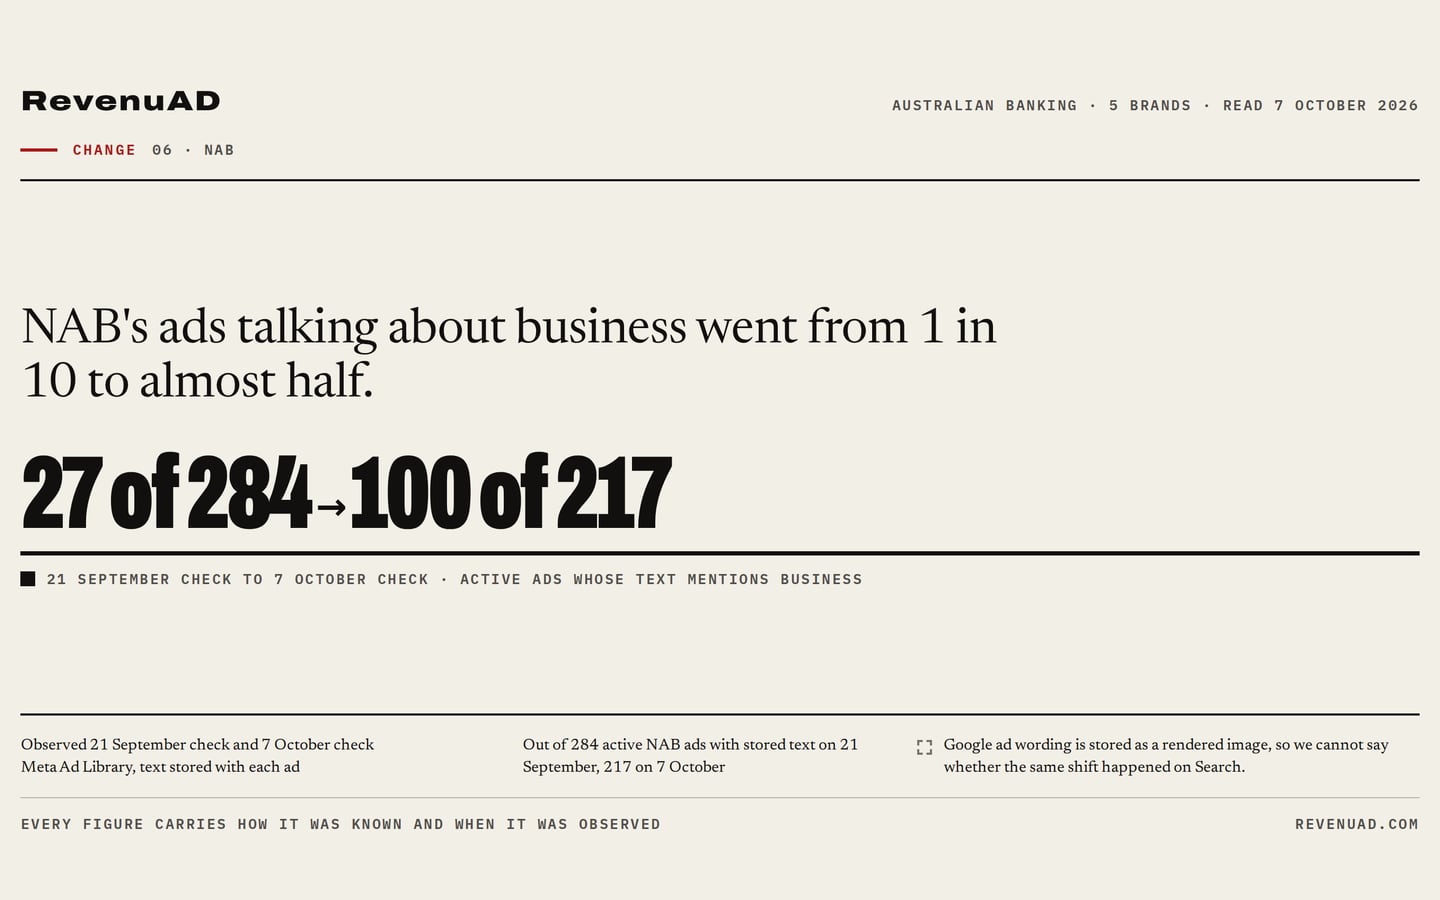
NAB's business ads went from 1 in 10 to almost half. One slide, its source underneath, ready to present.
One market view. Never added together.
Who it’s for.
Know what your client’s competitors are running, where, and since when, before you walk in.
See what your competitors changed on Meta, Search, Display, YouTube and LinkedIn, with the ads to prove it.
Walk away with the few things worth saying, and how we know each one.
01
Know what to say before the meeting.
The few things worth telling your client, with the ads to back each one up.
02
See where your client stands against its rivals, channel by channel.
Your client and its competitors side by side, one channel at a time. Each channel is counted on its own, so you always compare like with like.
03
Spot where the category is moving.
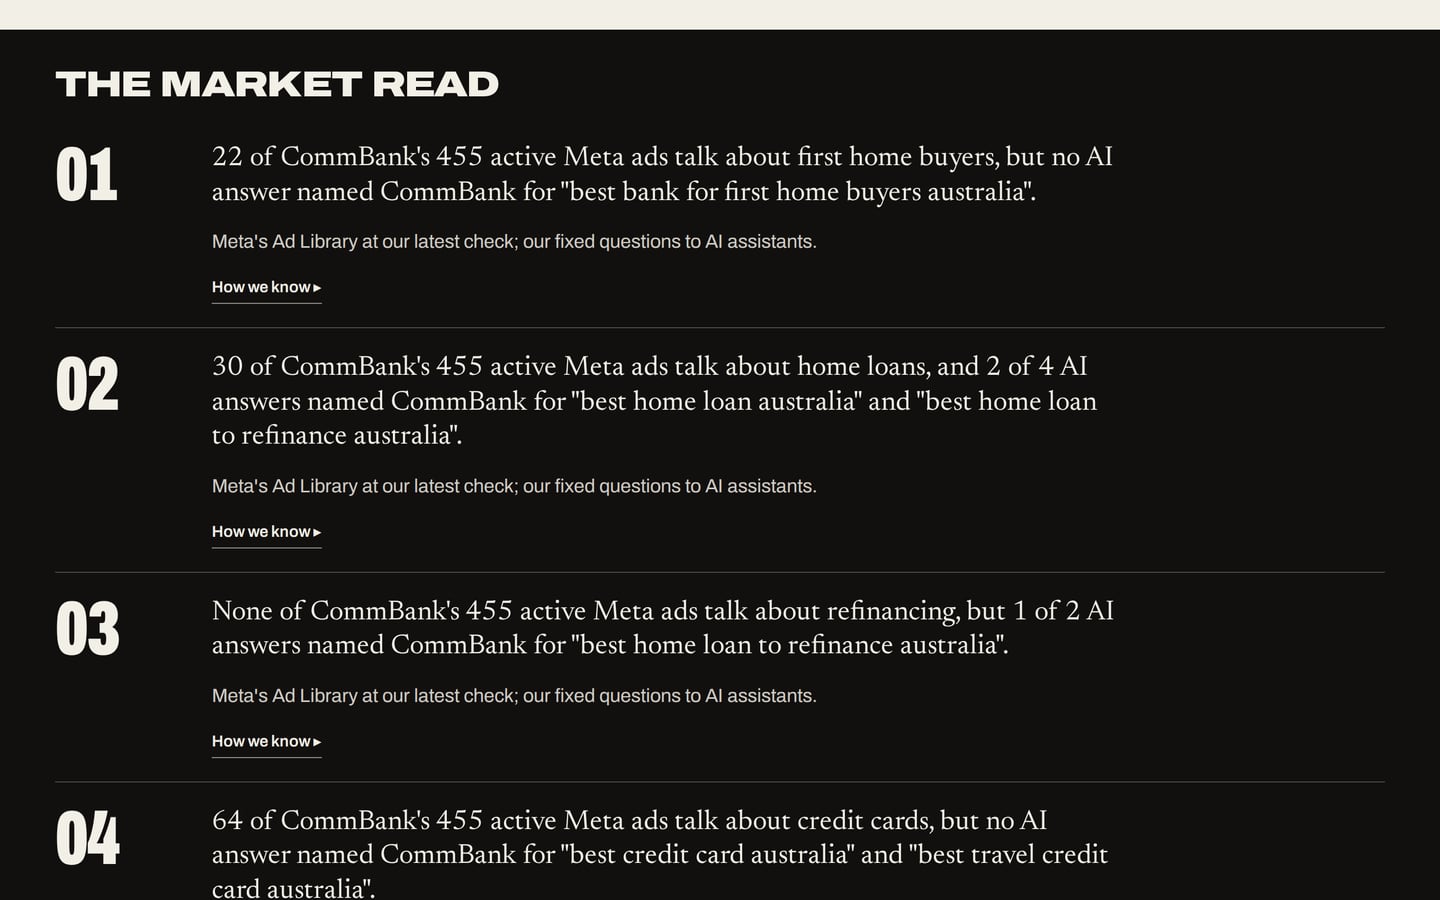
Where the category is moving. What people search for, what is new in the ads, the offers, and what changed on the homepages.
04
Show the ads behind the point.
Show me the work. The ads behind a finding, as they ran, with the day each started and the day we last saw it.
05
Answer “how do you know?” in one tap.
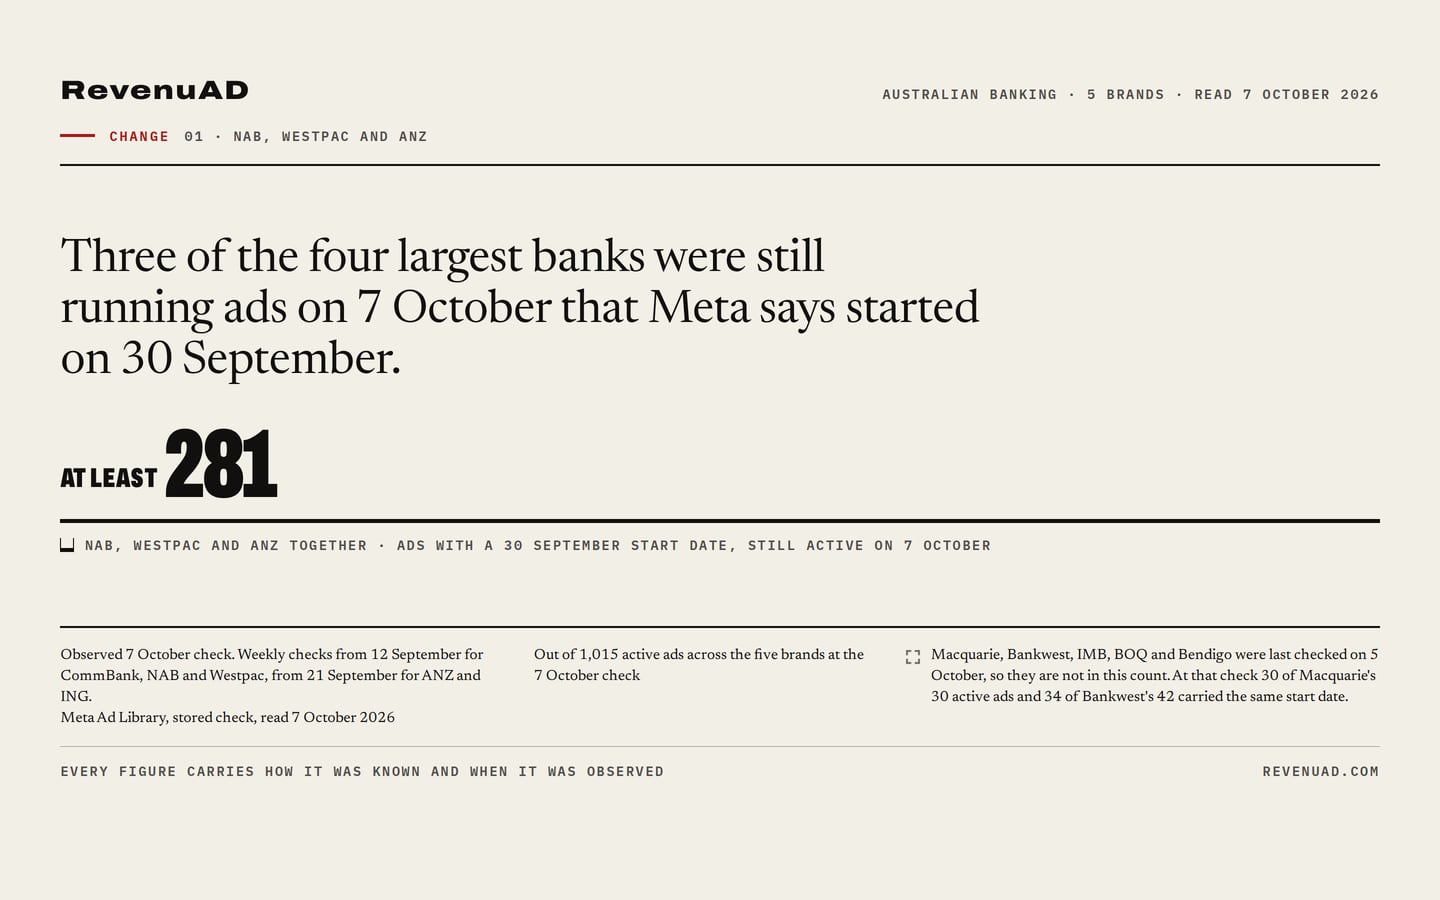
Prove it. The source, the date we looked, out of how many, and what we couldn’t see.
Every channel stands on its own. Meta, Search, Display, YouTube and LinkedIn sit side by side, never added together.
Every figure shows how we know: the source, when we looked, and out of how many.
When we can’t see something, we say so. A gap stays a gap, never a quiet zero.
Our worked example: Australian banking, 30 Sept to 7 Oct
NAB, Westpac and ANZ launched on the same day. CommBank and ING launched earlier that week.
Outlined: 30 Sept, the day NAB, Westpac and ANZ launched.
| 24 Sept | 25 | 26 | 27 | 28 | 29 | 30 | 1 Oct | 2 | 3 | 4 | 5 | |
|---|---|---|---|---|---|---|---|---|---|---|---|---|
| NAB | 0 | 0 | 0 | 0 | 0 | 0 | 113 | 74 | 9 | 3 | 9 | 2 |
| Westpac | 0 | 0 | 0 | 0 | 0 | 0 | 108 | 90 | 5 | 0 | 0 | 19 |
| ANZ | 0 | 0 | 0 | 1 | 0 | 0 | 60 | 2 | 0 | 0 | 12 | 13 |
| CommBank | 22 | 0 | 0 | 10 | 21 | 18 | 2 | 10 | 0 | 0 | 0 | 3 |
| ING | 2 | 0 | 0 | 0 | 1 | 34 | 1 | 0 | 0 | 0 | 0 | 0 |
Live Meta ads at our 7 October check, by the day Meta says each started. One scale for all five banks.
Moved on Meta. Nowhere else we could see.
113 of its 217 live Meta ads started on 30 September. On Google Search and Display, not one ad was first shown that day. We couldn’t read NAB’s YouTube at all, so we won’t call it a zero.
Hit Meta and Google at once.
108 of its 252 live Meta ads started that day. On Google, at least 14 Search ads and at least 67 Display ads were first shown too.
Meta, Search and YouTube. Not Display.
60 of its 112 live Meta ads started that day. At least 29 Search ads and at least 5 YouTube ads were first shown too. On Display, none was first shown that day: its 18 Display ads were first shown on 1 October.
Moved on Meta earlier that week.
71 of its 357 live Meta ads started between 24 and 29 September, and 2 on 30 September. On Google, at least 2 Search ads were first shown on 30 September.
Moved on Meta the day before.
34 of its 77 live Meta ads started on 29 September, and 1 on 30 September. On Google, no Search ad was first shown on 30 September; 2 were first shown the next day.
Same week. Three different media plans. Watch one platform and it looks like one story. It isn’t.
Open the demoOur worked example
The demo is a real category, with real ads and real numbers. Every figure opens to show how we know it.
Open the demo01
Pick your category and pop in your client’s website.
02
Competitors come next, straight after checkout.
03
Your own workspace will be ready within 48 hours, and we’ll email you the moment it is.
From A$799 a month
On the Agency plan, upload your logo in Settings and the deck and report carry it. Entry plan exports carry the RevenuAD mark.
We read your market’s ads on Meta, Google Search, Google Display, YouTube and LinkedIn. You get one view of the market, and every number keeps its source.
5 channels. 3 sources. 1 market view. Never added together.
Upload the brief you’re actually working to. We’ll read its objective, audience, competitors, key messages and channels, and use them to sharpen what you see.
Your brief shapes your view. Never anyone else’s.
Streaming TV ads, in the same market view as everything else.
We’re testing whether we can do this properly. It depends on technical and legal clearance.
See every move against what came before: when we last saw a message, how long a campaign has run, and whether a move is normal for that brand.
Built only from what we’ve seen ourselves. The history starts when we started watching.
Plug our data into your own tools: who’s advertising, their ads, when each was first and last seen, and how the market is moving. Every line of data keeps its source.
Same proof rules as everything else.
Two plans
Both start the day you pay. Your first workspace is ready within 48 hours.